This post presents the research on a technology to improve accessibility in indoor spaces by providing accurate directions when a user approaches pre-installed beacons. Currently, many routes lack this type of information. Inadequate navigation information limits autonomy and complicates decision-making. This leads to indecision for individuals who are navigating a space for the first time and, especially, those who are visually impaired. The technology developed in this study can be used in public spaces, such as airports, banks, hospitals, subways, museums, restaurants, bus stations, shopping malls and supermarkets.
The study sought to understand the users and their needs. On the basis of qualitative and quantitative research, an application was developed to meet the needs of real users. Low-cost sensors were also studied to ensure the feasibility of the project.
Introduction
Primary research indicated that individuals often get lost in large spaces in which maps and GPS receivers cannot provide the necessary information. Conversations with the visually impaired revealed their discomfort with the lack of autonomy that increases their reliance on others. This study aimed to develop technology to support independence and inclusivity and to prevent discrimination against those with special needs.
For the non-visually impaired, requesting the help of others, including looking for employees or information desks, is common. Depending on the size of the space, even the signs might be obscured, thus presenting difficulties for maneuvering within the space. The situation is worse for the visually impaired because even if the routes have directional signs, they cannot see them.
The research and development of a technology capable of identifying the user’s position on a route and providing accurate directions would alleviate this problem for not only the visually impaired but also the non-disabled.
The issue of ‘accessible routes’, especially for the visually impaired, has received increasing attention, and solutions have been explored by large companies. New developments have allowed for a focus on assistive technologies for individuals with special needs. This study explored the development of beacons; however, other studies have explored alternative technological resources. Beacons are low-cost underutilised sensors; thus, their efficacy for the development of new assistive technologies was investigated.
The product value was identified for the companies that adopt this system. The solution not only brings accessibility to an environment; it also provides more accurate information on consumer behaviour. Because these data are still very difficult to acquire, this study can provide a valuable contribution to a contracting company.
Concepts
Accessibility
The research goal is to give autonomy to people with visual impairments. Disability is not just a health problem; It is a complex phenomenon reflecting the interactions between features of the body and features in the society in which an individual lives (World Health Organization [WHO], n.d.).
Approximately 15% of the world’s population live with some disability, and approximately 1.3 billion live with some form of vision impairment. It has been reported that 188.5 million people have mild vision impairment, 217 million have moderate to severe vision impairment and 36 million people are blind (WHO, 2018).
A significant number of people with special needs are not being served by the existing urban infrastructure. Few places are truly committed to enacting legislation to improve the quality of life of people with disabilities. Changes are being made; however, the situation is far from ideal.
Assistive technology
With the advent of the Internet of Things (IOT), many cities are becoming smarter and more connected. Smart cities use the IOT to connect governments and citizens, to improve their infrastructure and to deliver new services. In addition, they use the potential of networks, sensors and management systems to address current challenges and to forestall future problems.
The term IOT was invented by Kevin Ashton in 1999. It is the logical connection between devices and the environment. Data are sent from devices, such as sensors, transmitters and computers, to databases for storage and analysis (Venturelli, 2014).
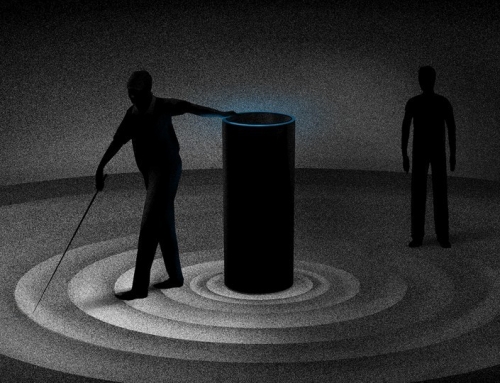
An inexpensive device that offers flexibility for use with the IOT is the beacon. Beacons emit information via Bluetooth Low Energy (BLE). Thus, any device with this technology can capture signals that are interpreted as a trigger to perform an action within an application.
With the development of new technologies come new opportunities. The challenge is harnessing this potential to complement special human needs, given the view that technology can facilitate inclusivity.
Assistive Technology (AT) is an area of knowledge that includes resources and services with the goal of providing or enhancing the functional abilities of a person with disabilities or with disabilities from aging. The purpose of AT is to promote the life and social inclusion of its users. (BERSCH, 2017, p. 2)
Data-driven marketing
In a world with ever more data, the challenge will be interpretation and the identification of them. Big data is the term used to describe the large volume of data that impact businesses daily. According to Norman (2013), the advent of the internet and the ability to evaluate vast amounts of data have given rise to new methods of quantitative market analysis:
[A] website can capture a wealth of information about people and their behavior: age, income, home and work addresses, previous purchases, and other websites visited. The virtues of the use of big data for market research are frequently touted. The deficiencies are seldom noted, except for concerns about invasions of personal privacy.… But the use of big data and market analytics is seductive: no travel, little expense, and huge numbers, sexy charts, and impressive statistics, all very persuasive to the executive team trying to decide which new products to develop. (p. 225)
Managing these data to attract users, to identify problems and to increase market share is already a reality in the digital world. Digital marketing is the set of activities that a company (or person) performs online to attract new business, to create relationships and to develop a brand identity.
Business Intelligence is the collection, organisation, analysis, sharing and monitoring of information that supports business management. It facilitates the transformation of raw data into meaningful and useful information for a company. Data are less accessible in an offline shopping environment than in e-commerce. However, with the connection of objects and users through the IOT, the customer information can be captured. The research in the real world can thus yield data that are as rich as the data in the digital world and provide opportunities for developing personalised marketing strategies.
Goals
The research goal was the development of sensor validation to guide blind users through indoor spaces by the use of mobile applications. In addition to testing the technology, the study assessed the business model and the target audience needs.
The main outcome was the development of a digital technology capable of identifying the user position on a route. In addition, the technology provides accessible and accurate directions for decision-making on routes that lack this information.
The implementation of the beacons was studied and validated for the identification of the user’s position. The initial result was the development of an application for testing the beacons and validating usability.
Methodology and results
The methodology combined agile software development (agile) and design thinking. Using lean start-up principles, the study focused on rapid development and testing.
Design thinking is a human-centered approach to innovation that draws from the designer’s toolkit to integrate the needs of people, the possibilities of technology, and the requirements for business success. (Brown, n.d.)
The design process was the Double Diamond created by the British Design Council (2005). The steps are grouped into four phases: discover, define, develop and deliver. The Double Diamond is a visual map of the design process. Solutions are achieved through divergence and convergence, expansion and filtering.

The design process and the Double Diamond
Source: https://www.designcouncil.org.uk/news-opinion/design-process-what-double-diamond
The research process was iterative. The design was user-centered; thus, user feedback was received at every stage.
The process was divided into two phases: strategy and implementation. The strategy encompasses the initial activities of design thinking, and implementation is the development phase through the use of the agile methodology. Scrum, an agile methodology framework, was used to manage product development.
The strategy phase began with immersion. Exploratory research was conducted. More than 80 people were interviewed to gain an understanding of the problems. Next, a benchmark analysis was performed to gain deeper insights into the competitors and other companies in the market. On the basis of these data, a survey was designed to validate these insights. Through a profile analysis, personas were created, and ethnographic research allowed for the observation of the target users to facilitate the construction of the user’s journey. In the ideation phase, the screen wireframes were created, prototyped and tested with the users.
On the basis of the discoveries made during the strategy phase, a product backlog was created. In the implementation phase, the beacons were tested, the indoor area was mapped and the application was developed.
The process was iterative. While immersive research was being conducted, the data were analysed, and ideas were generated and tested. The succeeding sections present the results of each process and the development of the product.
Discovery
The first step was interviews, which were conducted between October and December 2017. The methodology was based on Steve Blank’s customer development (2013) and Osterwalder and Pigneur’s Business Model Canvas (2010). The goal was to promote the development of sustainable products and services and to generate significant results for the company.
The researchers were encouraged to leave the office to conduct interviews to validate the business model. The objective was to create an iterative workflow in which each interview could enhance the canvas with new information. The process started with a canvas containing open information. Initially, it was believed that the value proposition would provide indoor navigation and improve productivity.
The researchers went to the city to interview people from different customer segments. The semi-structured interview method was used. The script provided the flexibility to pursue new and/or interesting avenues raised in the conversations. According to Constable (2014), the interview ‘will probably evolve as you learn about the market and discover new questions’.
Because there was still no focus, the interviews included as many areas as possible. Visually impaired individuals were interviewed, as were officials from museums, supermarkets and airports.
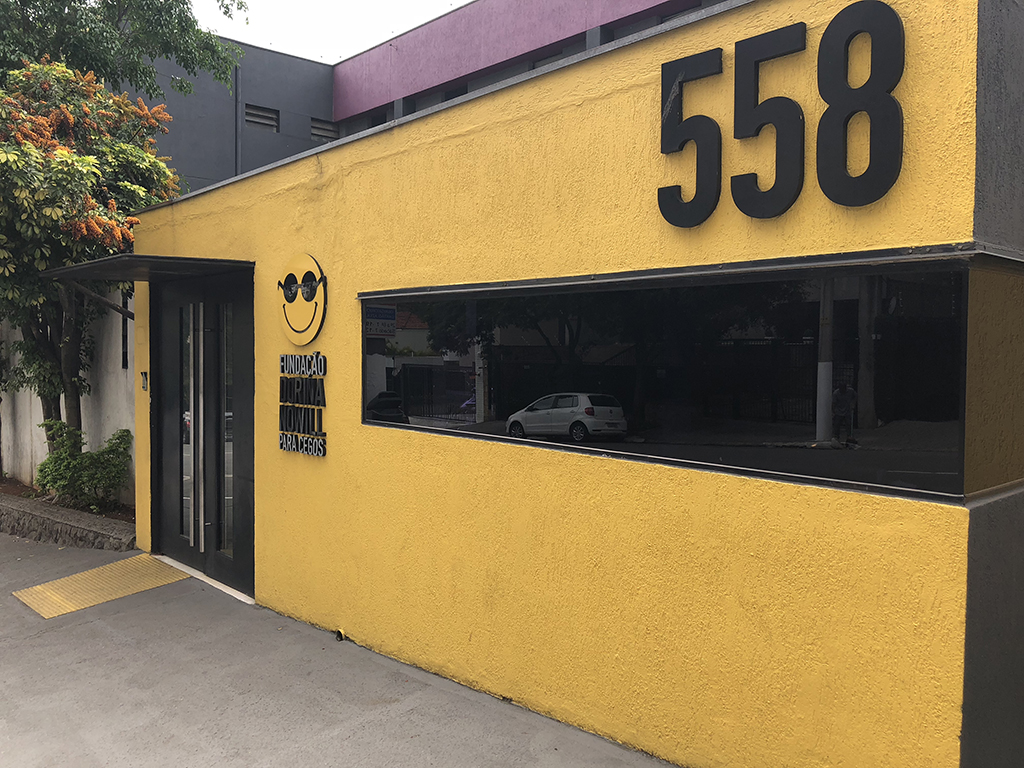
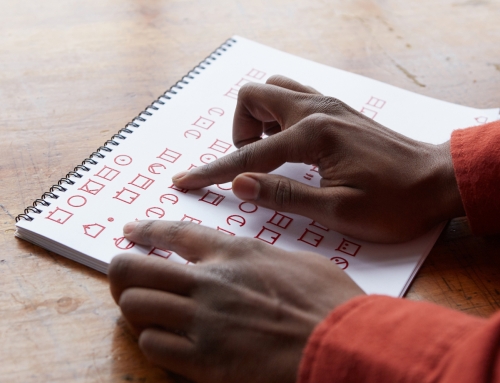
Philanthropic Organization for the visually impaired visited
Initially, it was thought that passengers who got lost in airports could delay flights; thus, employees would be relocated to assist customers with special needs. These customers were found not to be the cause. Requests for information to employees in supermarkets were frequently observed.
Interviews with users with disabilities indicated that their main problem was access to shopping malls and supermarkets because these spaces did not allow for autonomy. Other potential users not included initially were the elderly and foreigners.
In total, 86 in-person interviews were conducted. Nine participants worked in supermarkets, four in airports, three in museums and five in schools. Fifteen participants had some type of disability, nine participants were foreigners, eight were elderly, 15 were non-disabled and 18 were researchers. Of the users with special needs, seven were blind, five had mobility problems, three had intellectual disabilities and one was deaf.
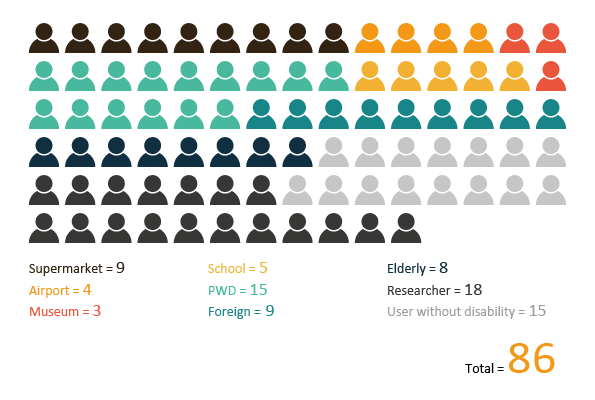
Total interviews
The main value proposition for companies is the alignment of consumer information with personalised communication: not just accessibility. Thus, the value proposition was changed, the companies would have personalised content for their clients and real user information. The clients were segmented as the disabled, the elderly and foreigners.
The results of the interviews yielded new opportunities for the clients. The product could help foreigners, the elderly and the visually impaired, thereby increasing the target audience.
Quantitative research
After the interviews were completed, quantitative research was conducted to better understand the target audience’s consumption habits. The sociodemographic researches (e.g. gender, age, income and schooling) didn’t provide insights into consumer behaviour. The qualitative research suggested some trends; however, a larger sample was required for quantification.
Quantitative methods include benchmarking, web analytics, A/B Test, card sorting, surveys and eye tracking. The methodology chosen for this study was the online survey.
Surveys are a flexible user-research tool. You can administer them in a variety of contexts – as short intercept surveys on a live website, in emails, or after a usability test.
They can produce combination of quantitative and qualitative data – ratings, proportions of answers for each choice in a multiple-choice question, as well as open-ended responses. (Moran, 2018)
The Google Forms application was chosen because of its accessibility through screen readers. In addition to being responsive, this application can be well visualised on mobile devices and larger screens.
The research audience was composed of the elderly and the visually impaired, as well as the general public. The goal was to understand the effects of consumption and digital inclusion on their lives. Of the 122 responses obtained, 77 were from the visually impaired and 36 were from the elderly.

Visually Impaired Participants
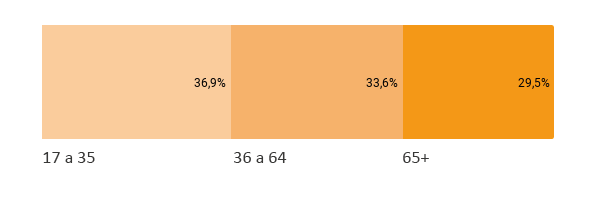
Ages of the participants
The behaviors of the participants with low vision and total blindness were analysed. Even fewer, they have interesting particularities to be analysed separately. Of these participants, 55.6% were men, 66.7% were 36–64 years old, and more than 44.4% had completed higher education.

Ages of the visually impaired participants
All the participants had mobile phones. The number of Android and iPhone devices was the same. The most used applications were WhatsApp, which was used by all the participants; Facebook, Google Maps and Waze were also mentioned.

Apps used by the visually impaired
It was interesting to explore the role of smartphones in the routines of the visually impaired. The usability of the most used applications served as a reference for the project because replicating these types of interactions would reduce the learning time.
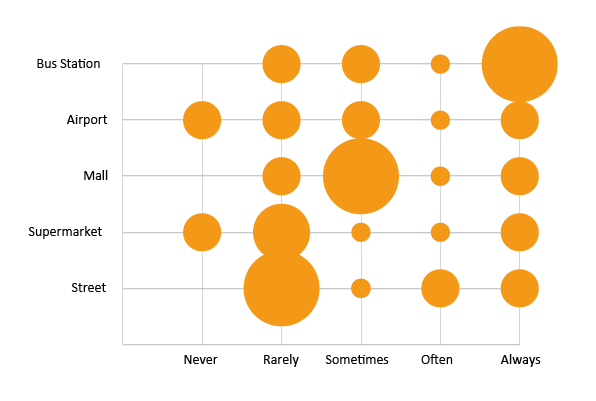
Frequency distribution of mobile phone use by the visually impaired
Understanding how often the visually impaired used mobile phones in public places allowed for their needs to be addressed. It was observed that they rarely used mobile phones outdoors because of safety concerns. The two places in which mobile phones were used most were shopping malls and bus stations.
Location applications were not used very much. Google Maps was the most used. This indicated a challenge: the need to enter a market that still does not provide assistance to this audience.
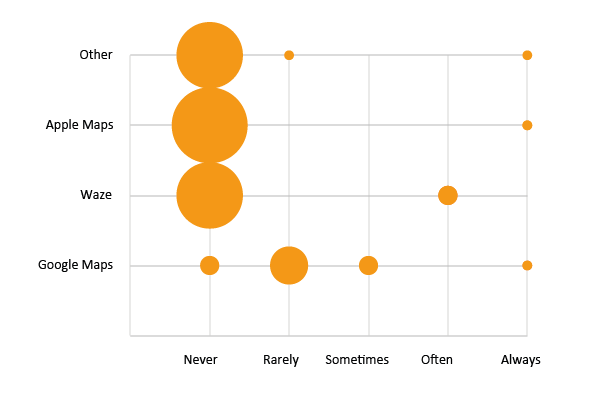
Frequency distribution of location application use by the visually impaired
The shopping strategies of the visually impaired were unclear. The extent to which they depended on others, found online shopping easier or went to the store was unknown. The results indicated that none of the participants made online purchases. They were not confident about selecting the correct product or checking for purchases delivered. A majority indicated visiting supermarkets and shopping malls.

Supermarket shopping strategies of the visually impaired

Shopping mall use by the visually impaired
The analysis of the behaviours in the supermarkets and shopping malls showed an important difference. In the supermarket, the participants purchased the items on their lists. In addition, they looked for offers and tried to save money. While shopping malls presents these opportunities, they are also associated with leisure. Most of the participants (77.8%) stated that they went to the shopping mall to eat because it was a safer place and a more controlled environment. In addition, many of the visually impaired people indicated that the shopping mall was an ideal place to shop and to walk. Although accessibility was limited, the shopping mall was still more inclusive than the street. The extent to which they achieved their goals was influenced by the attendants.
The last question in the survey, the participants were asked about the places that they visited alone. The goal was to determine the extent of their autonomy and the ways in which they navigated different environments.
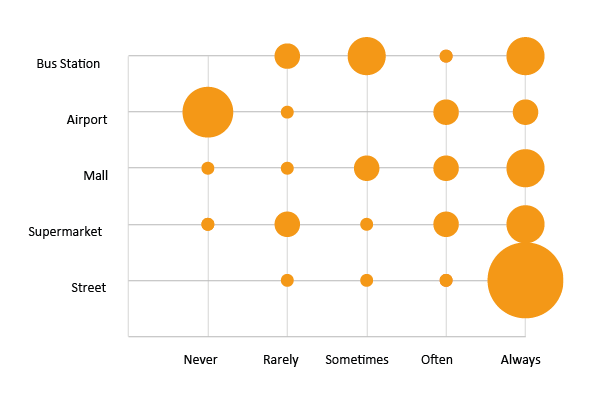
Frequency with which the visually impaired leave home alone
In general, the participants with visual impairments went out on their own because of the difficulty of always having an available guide. An interesting finding was that many participants did not usually go to the airport on their own. This might be explained by the fact that they were always accompanied or that they could not afford air travel.
The survey confirmed that mobile phones were often used in shopping malls. The analysis identified issues for further investigation; thus, the study will need to be continued to gain a better understanding of the challenges identified thus far.
Ethnographic research
This step consisted of field research with the objective of observing, in a real environment, the behaviours of visually impaired people at the moment of purchase. According to Lévi-Strauss (1963), ethnography includes the methods and techniques related to fieldwork, classification, description and the analysis of cultural phenomena.
The technique that was chosen was shadowing. It involves following a user over a period that includes their interactions with the analysed service. The researcher cannot intervene; s/he can only observe. This provides insights that would not emerge in an interview.
The places chosen for the ethnographic research were two shopping malls located in a neighbourhood with an institute for the visually impaired, who were frequent visitors.
The observations were done on one day, starting at lunchtime. The researcher was located at the shopping mall side entrance, which was more accessible from the institute. When a visually impaired visitor entered the building, the researcher would monitor the individual’s activities and record the observations in a field diary.
The annotations comprised observations, reports on the environment and the visitors’ attitudes, and interpretations.
During the activity, five visually impaired visitors were accompanied. Below are the observations:
Location: Shopping Mall 1
Time: 12:00 – 15:00
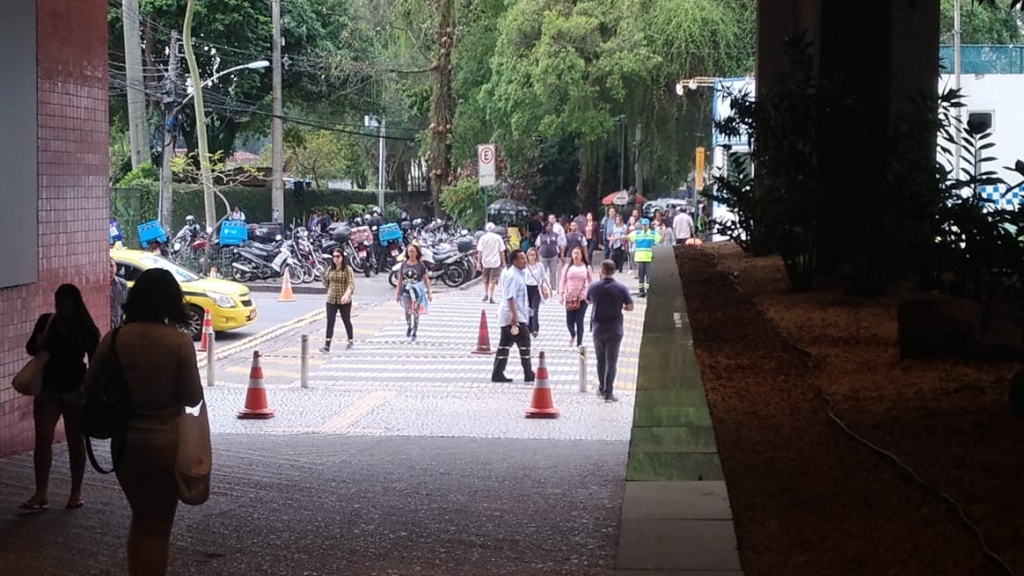
Side entrance of Shopping Mall 1
Observations:
- The sidewalk outside the shopping mall had tactile paving.
- Inside the shopping mall, the tactile floor signalled stairs and ramps.
- The interactive shopping mall directory had a touch screen without audio feedback; thus, it was not accessible to the visually impaired.
- A touch screen on one of the two directories that were tested did not respond accurately.
- There were many unaccompanied elderly visitors.
- Many visitors looked at their mobile phones while walking.
- Some restaurants in the food court provided a number on a sheet of paper for the waiting customer. When the food was ready, a whistle sounded, and the number appeared on a display. Thus, identification was impossible without the sense of sight.
- Other restaurants had more accessible devices that vibrated, lit up and made noises when the meal was ready.
- The food court was densely furnished. There were many tables and narrow aisles.
12:15 – The first visually impaired visitor entered the shopping mall with a folded cane in his back pocket and his hand on a woman’s shoulder. He stayed for 30 minutes.
12:20 – Two visually impaired people entered holding a sighted woman’s arm. In a department store, they felt the texture of a coat and asked the price. They went to the cashier, the blind man paid with a card, he lowered his head and lifted the machine to hear the purchase confirmation.
14:50 – A foreigner entered, went to the information desk and asked whether the attendant spoke her language.
14:50-15:00 – In 10 minutes, 13 people asked for information at the information desk, and two young girls in school uniforms checked the shopping mall directory.
Interpretation:
- The shopping mall floor did not provide directions for the visitors. There was no reference for their location.
- All the visually impaired visitors walked the same path through the empty corridor even though it was farther away. Initially, it was expected that they would choose the shortest route; however, they used the longest, which had fewer obstacles.
- The interactive directory was not widely used by the elderly visitors. It could be that they found it difficult to use or that it was not user-friendly.
- The visitors’ preference to check with an attendant rather than use a digital device presented a challenge, how an application could generate interest in this audience.
- The food court was not an inclusive space. No matter how well a blind visitor could navigate to a restaurant, s/he would still have difficulty buying and waiting for food if the restaurant is not accessible.
- As was identified in the exploratory survey, foreigners could be a target audience because few shopping mall workers speak other languages.
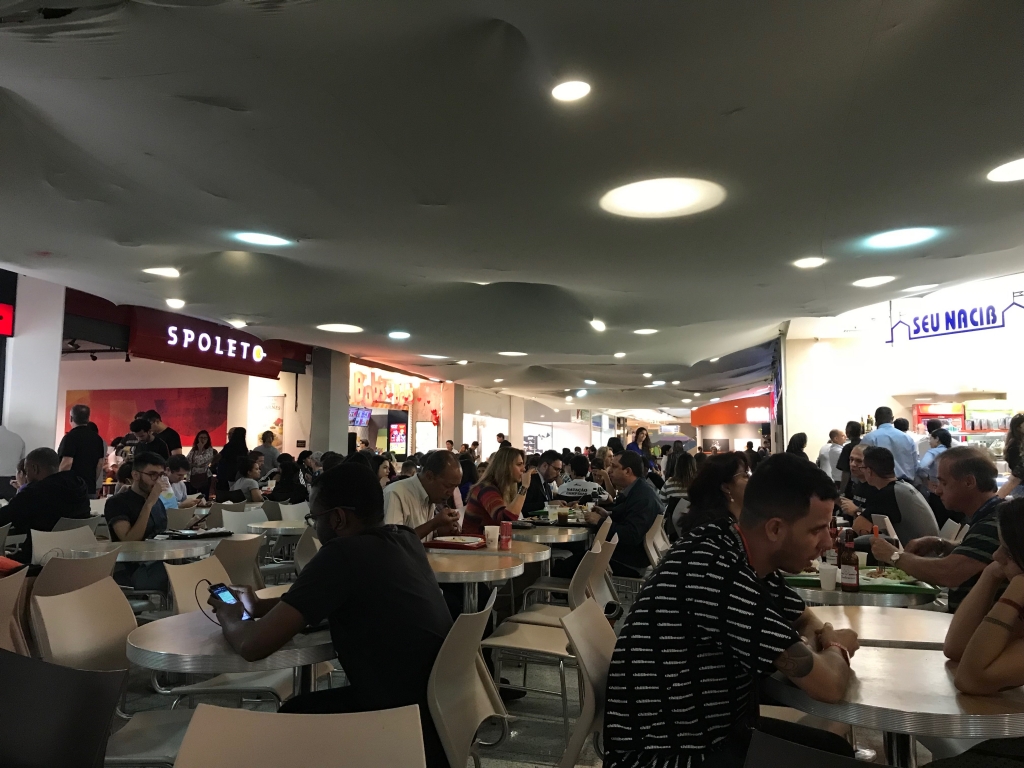
Shopping mall food court
After the observation period, the researcher talked to a shopping mall security guard who often helps visitors with special needs. He indicated that it was common for blind people to visit the shopping mall alone and that sometimes someone would help them from the street to the entrance. Once they were inside, the security guard enquired about their destination and led him there.
Location: Shopping Mall 2
Time: 15:15 – 17:15
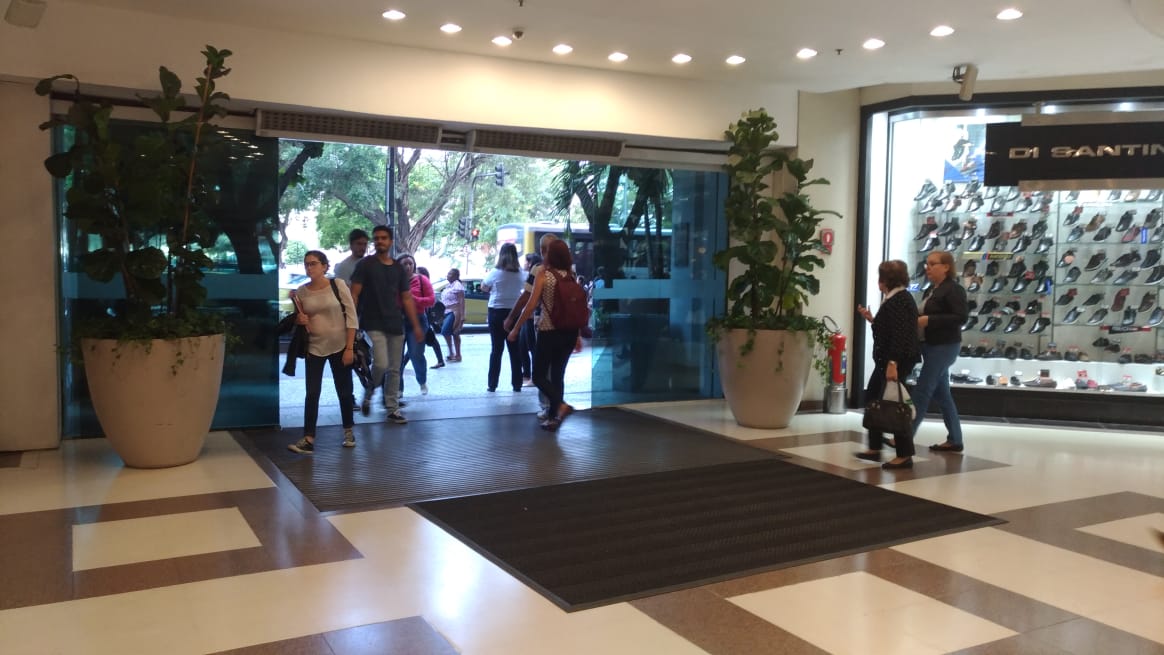
The main entrance of Shopping Mall 2
Observation:
15:20 – A blind visitor entered. Someone led her from the street to the shopping mall entrance. She had a cane, and the security guard asked her where she was going. They started to walk into the shopping mall. When she provided him with the information, the security guard turned around and left her at the door. He pointed to the direction she should follow; however, she obviously could not see where he was pointing. Another person on the street approached her and guided her to the bank branch located on the same sidewalk as the shopping mall entrance. She entered the bank by herself and was helped by people at the bank.
15:45 – An elderly couple entered the shopping mall. The man was blind, but the woman was not. His hand was on her shoulder. At the escalators, she took his hand and directed it to the rail. They entered a retail store, and she provided information about the cheap products. She asked an employee for information and then spoke with the blind man. They seemed lost. They walked very slowly up and down the same corridor. She looked at the shop windows and made comments until they left the shopping mall.
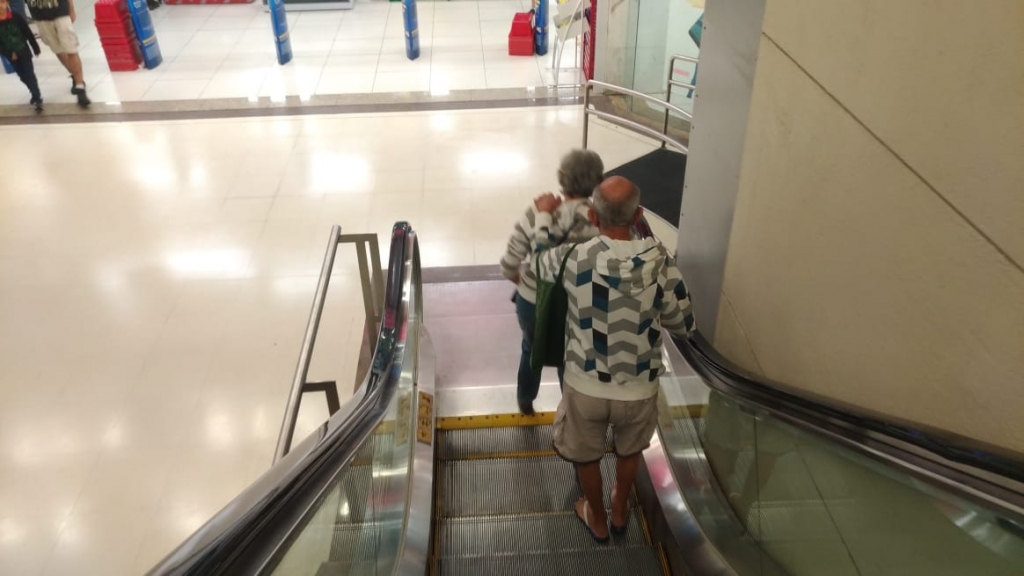
Couple at Shopping Mall 2
Interpretation:
- The blind visitor who went alone to the shopping mall was taken from one person to another. There was no autonomy.
- Communication problems caused her to go to the wrong places. Sometimes people wanted to help. Someone would leave her in a different location even if it had not been her destination.
- Even the sighted companion got lost. She did not know where to find the product that she was looking for. She asked the staff for information, but they were unable to help.
Understanding user behavior is important. The pain points can be addressed, and the product experience can be enhanced.
User persona and journey map
At the end of the immersion stage, it was possible to create the main persona to represent the target audience. According to Cooper (1998), personas are fictional characters representing different groups of users. These personas facilitate decision-making and the ability to reach a larger group of people represented by these characters. In this case, the characteristic for the main persona was visual impairment.

Blind persona
Name: Marcelo
Age: 40 years old
Occupation: Lawyer
Hobbies: He likes to have lunch at the shopping mall and to travel to the beach on the weekend
Mobile: iPhone
Apps most used: WhatsApp, Facebook and Google Maps
Buying behaviour: He likes to know about promotions and to take advantage of discounts on unplanned purchases
After investigating the persona behavior with the data from previous research was created the user’s journey. According to Stickdorn (2012), the user’s journey is a tool for visualising the sequence of a person’s experiences while using a product or performing a service. Therefore, a journey map of Marcelo’s visit to the shopping mall for lunch during his work break was created.
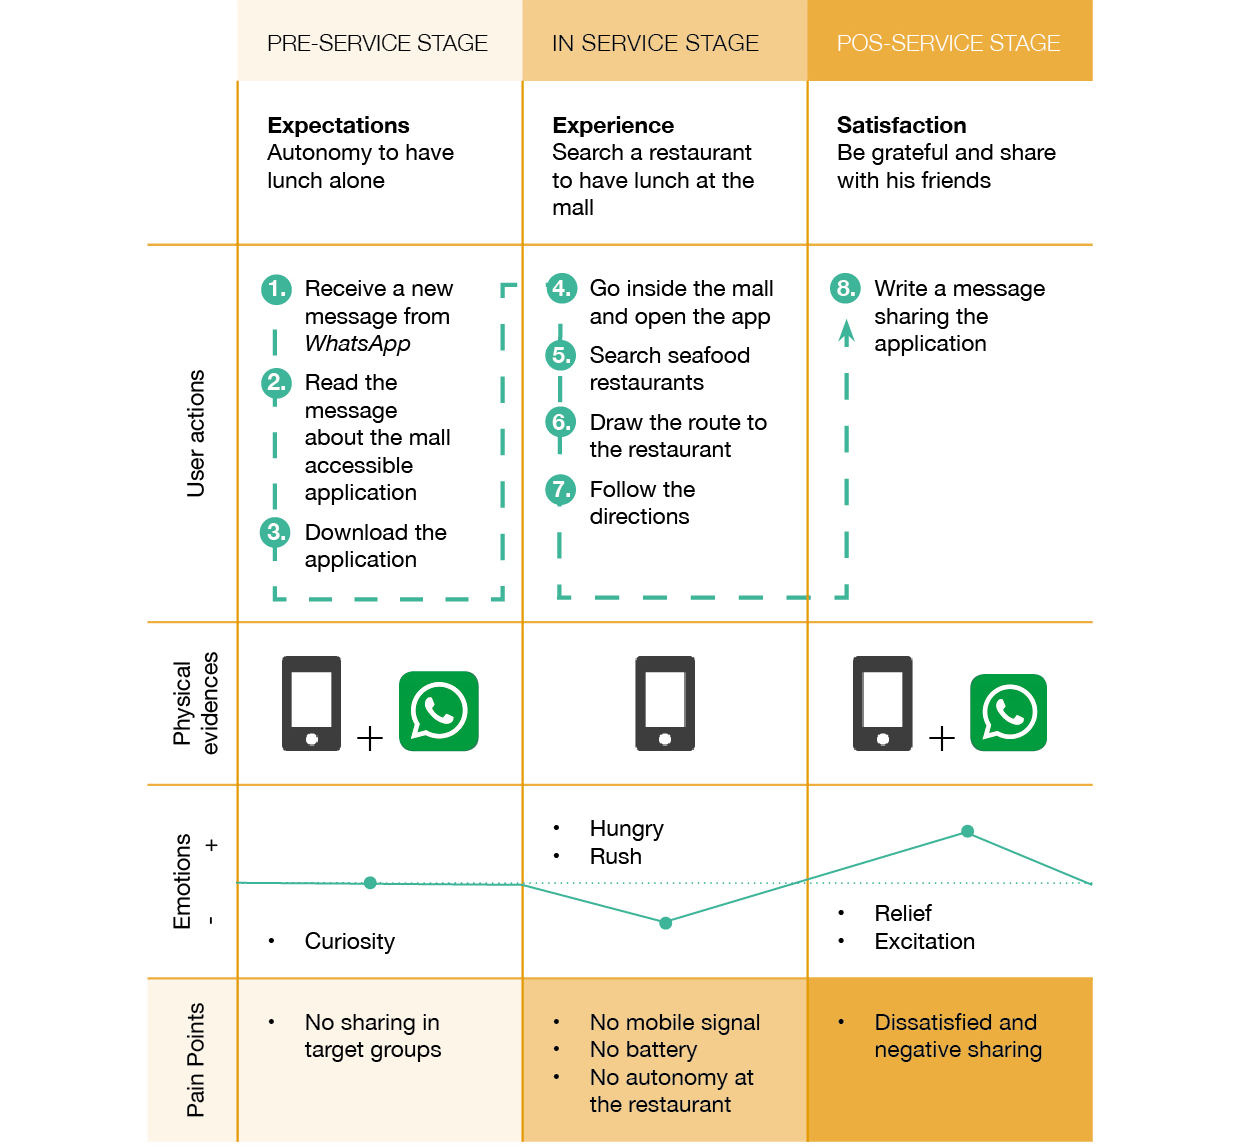
Customer Marcelo’s journey
A design that met Marcelo’s needs allowed for the development of a product that was appropriate for all target audience.
Prototyping
After the problem was explored, the data were analysed and organised. Next were the proposal and test stages. Initially, the screen wireframes were designed to represent the main idea. A wireframe is a draft that positions the information and enables navigation.
From these wireframes, a low-fidelity prototype was created to facilitate product validation.
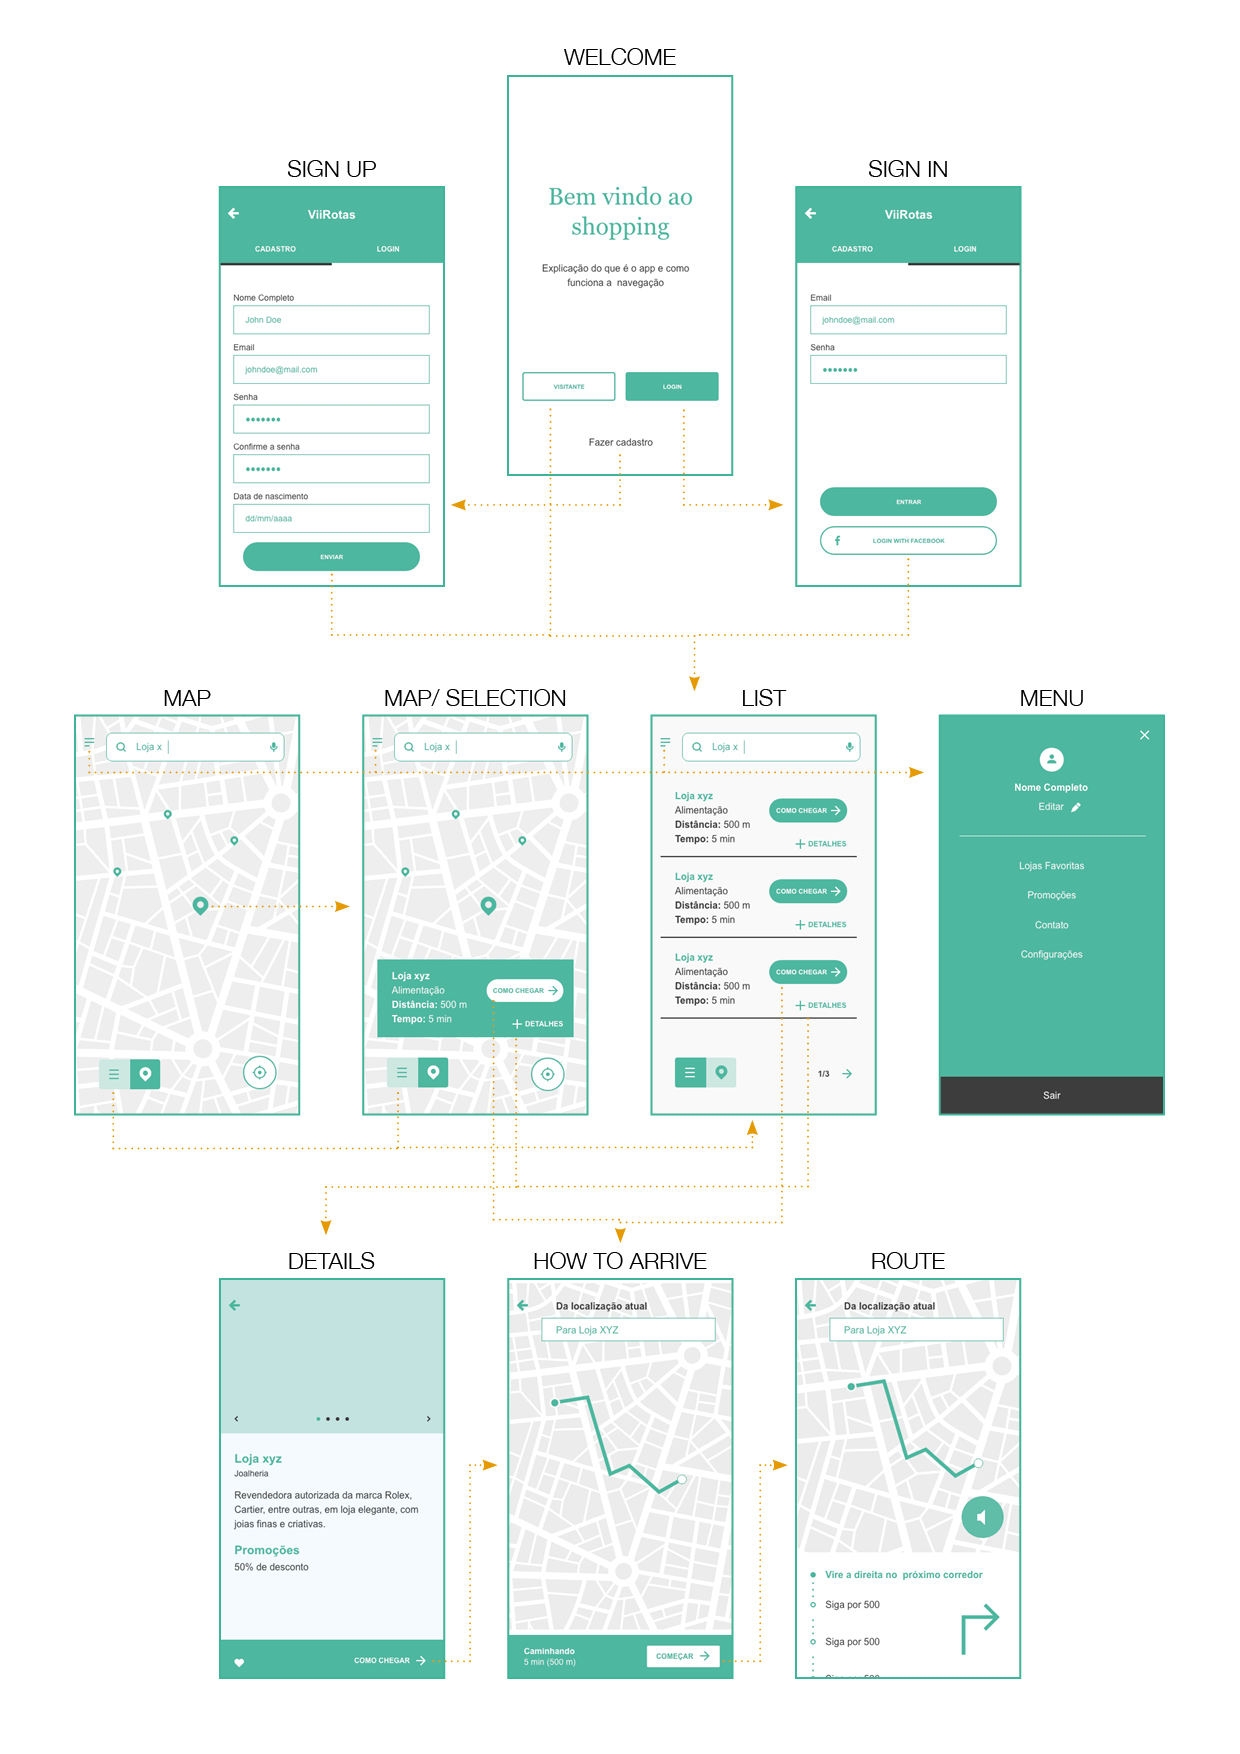
Wireframes and navigational flow
According to Norman (2013), a prototype is the simulation of a system that has not yet been built:
The only way to really know whether an idea is reasonable is to test it. Build a quick prototype or mock-up of each potential solution. In the early stages of this process, the mock-ups can be pencil sketches, foam and cardboard models, or simple images made with simple drawing tools. (p. 227)
The first challenge was to learn how to test a low-fidelity prototype. It was not possible to invest a great deal of time in developing an application for testing; however, a paper prototype would not have been appropriate for the visually impaired users.
According to Knapp (2016), the prototype mindset should be temporary simulation rather than long-term quality.
Prototypes are disposable
Don’t prototype anything you aren’t willing to throw away. Remember: This solution might not work. So don’t give in to the temptation of spending a few days or weeks getting your prototype ready. You’ll be falling deeper in love with a solution that could turn out to be a loser.
Build Just Enough to Learn, but Not More
The prototype is meant to answer questions, so keep it focused. You don’t need a fully functional product – you just need a real-looking façade to which customers can react. (Knapp, 2016, p. 169)
The software that are most often used for creating prototypes transform the text and elements into images; consequently, they are not accessible in screen readers. The HTML format must be used for creating an accessible prototype. However, coding knowledge is necessary, and this makes the process more laborious and time-consuming. An alternative was therefore developed.
The wireframes were designed in InDesign and exported as a fixed-layout EPUB file. Thus, the file was based on HTML standards, which are recognised by screen readers but do not need to be programmed separately. EPUB is a format for digital publications and documents. It is based on web standards and can be viewed on devices with e-reader programs. The fixed-layout format was used because it maintains the wireframe interface for testing with low-vision users.
The usability test consisted of performing a task: navigating the prototype to arrive at a nearby identified store that had not yet been integrated into the beacon mapping.
In a usability test, one user at a time is shown something (whether it’s a Web site, a prototype of a site, or some sketches of individual pages) and asked to either (a) figure out what it is, or (b) try to use it to do a typical task. (Krug, 2006, p. 133)
During the test, the researcher used the cooperative evaluation method through the think-aloud technique. According to Monk et al. (1993), cooperative evaluation is a way to receive information to improve a product. Unlike other methods, cooperative evaluation allows the researcher not only to observe the users’ interactions but also to integrate them into the evaluation process. The users thus become collaborators (Oppermann and Reiterer, 1997).
Through the think-aloud technique, in which users verbally express their problems, thoughts and opinions, open-ended questions encourage them to provide more detailed answers (Snyder, 2003).
Users testing the prototype
During the test, the users’ behaviours were observed, and they were able to suggest improvements.
The participants navigated by going to the next field and sliding to the right, as is done on a computer with a keyboard. The information sequence is important, and the page must be structured logically. The link focus and the element labels are read sequentially in standard pages: from top to bottom (Queiroz, 2008).
The users encountered a difficulty: the lack of a sense of space and direction. When the application said ‘right’, the angle being referred to, e.g. 30° or 90°, was unclear. The sense of distance was another problem; thus, the participants suggested to use step counts rather than meters to quantify their positions.
These issues are very pertinent and should be tested later with a fully functioning application in a mapped environment. User identification accuracy is crucial for spatial orientation.
Feedback and suggestions are very important for application performance improvement. On the basis of these observations, the product backlog was enriched and prioritised. The prototype allowed the team to become familiar with the format of the application so that the product could be developed to meet the needs of the target audience.
In addition to facilitating product improvement, usability tests are interesting because they provide opportunities to make contact with the audience, to hear their opinions and to demonstrate the relevance of the project. Users are happy to be heard and to know that research will make their lives easier.
Proof of concept
After the strategy stage, during which the project structure was researched, came implementation and development. According to the initial proposal, the beacons had the technological capability to map the internal areas and to provide directions for users.
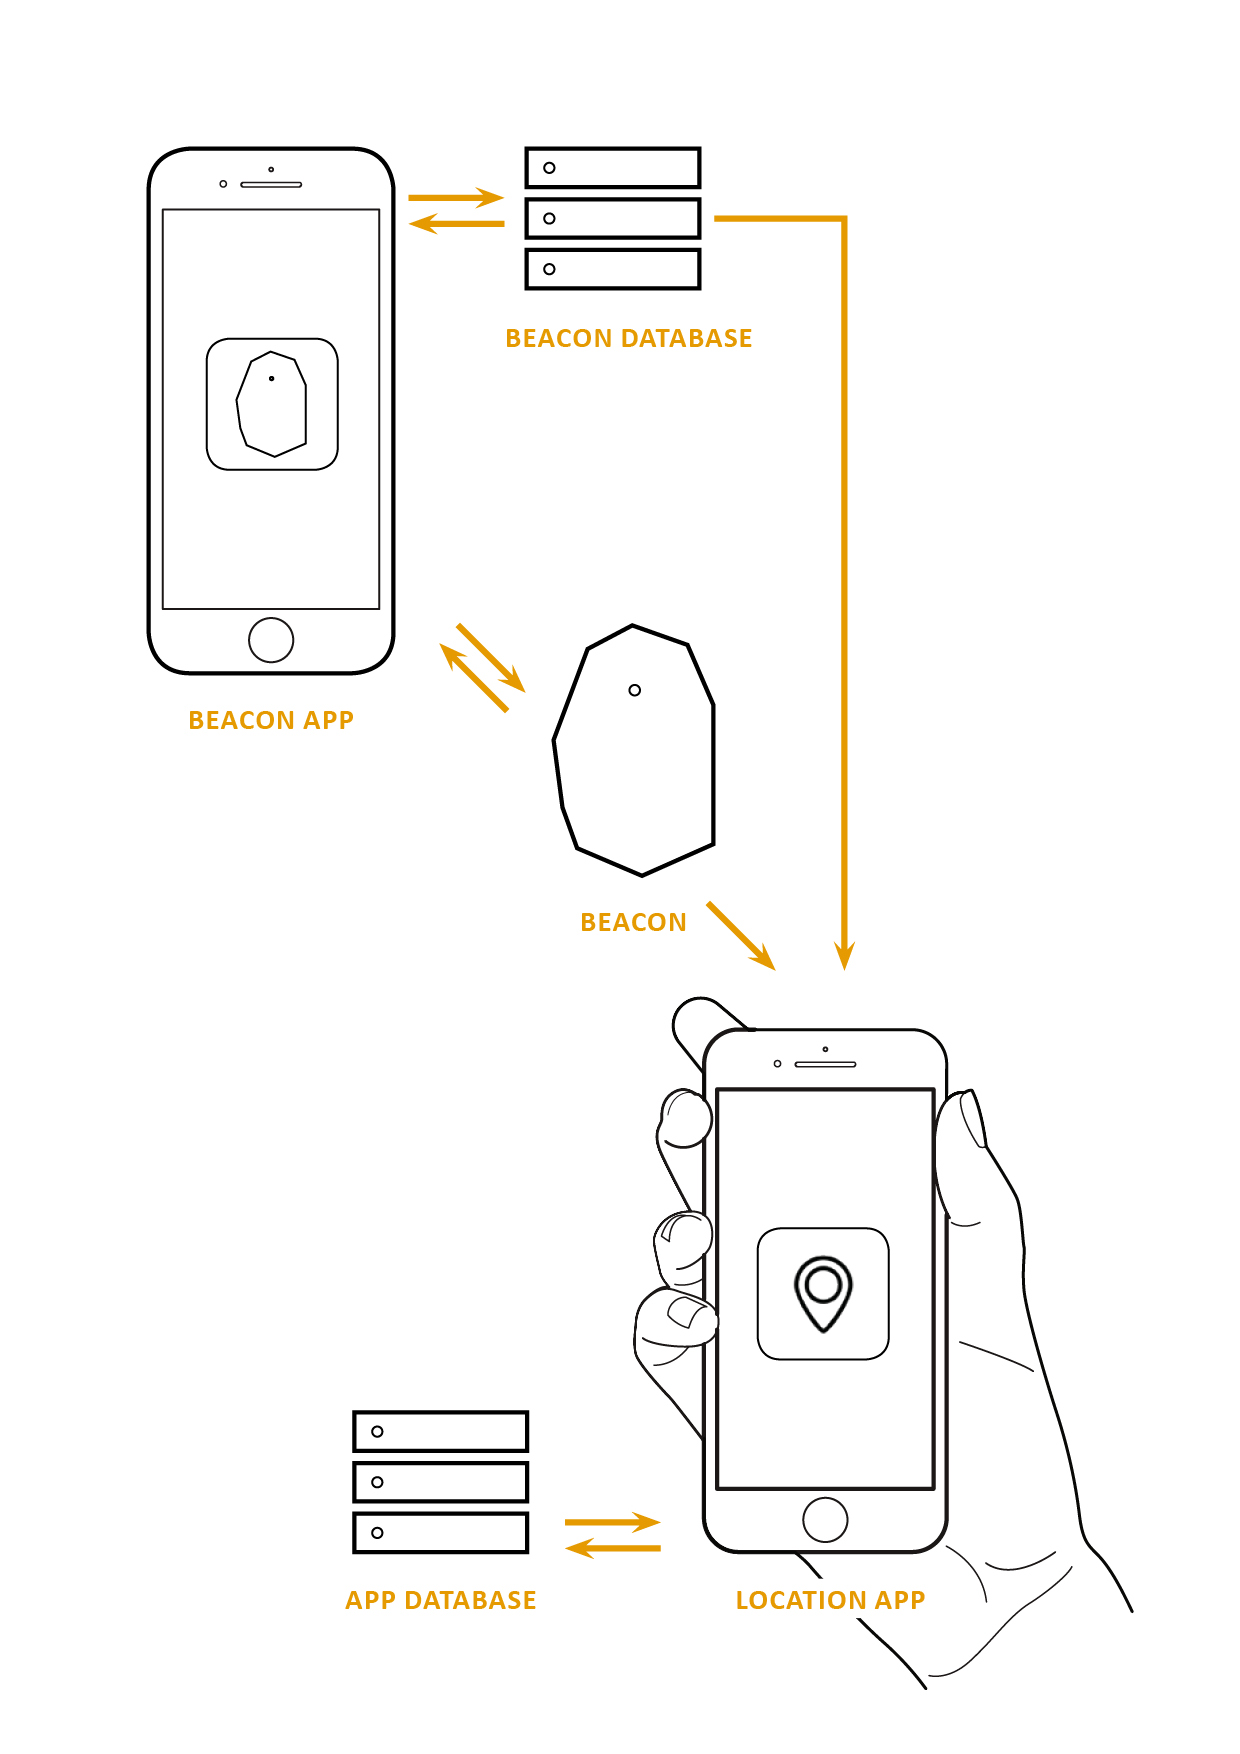
Operation of the beacons
The information collected in the beacons is stored in a database. When a device with the application enters a mapped area, this information is captured by Bluetooth and integrated with the preformatted data.
The mapping was accomplished by installing the beacons and synchronising them with the application. When four beacons are installed in a room, the application identifies and traces the inner area.
For the proof of concept, the researchers contacted a center for attention to persons with disabilities. The goal was to test the technology and usability with a user in a controlled environment.
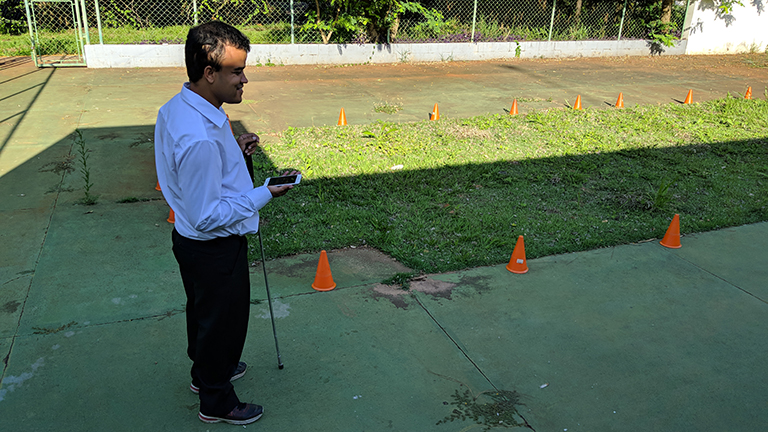
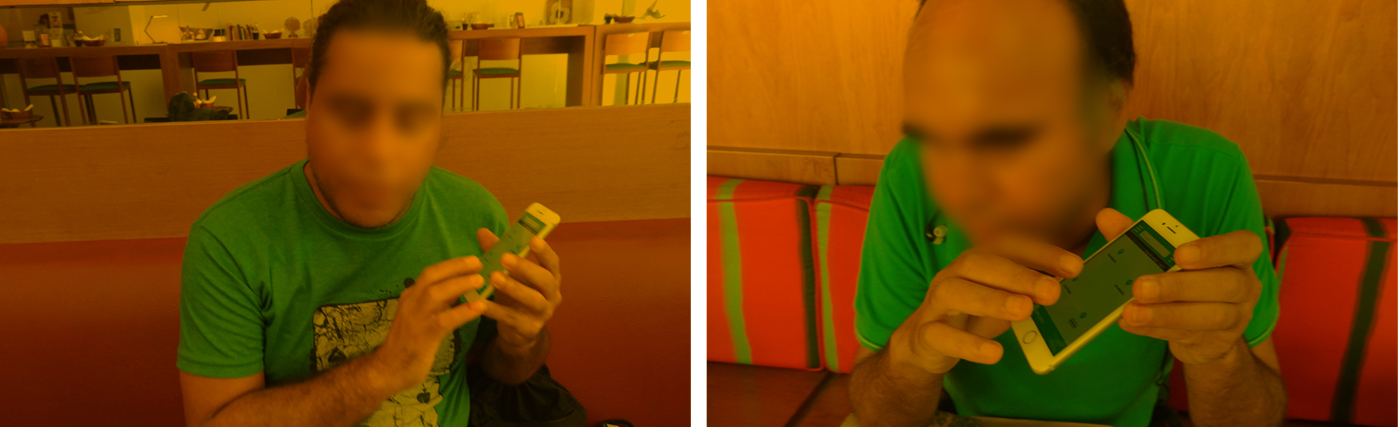
Usability test with a visually impaired person
In the Centre, an external area of approximately 12 × 9 meters was defined and measured. In the application, it was necessary to add the mapping and obstacles that would be used in the navigation tests.
To simulate a route, a rectangular obstacle of approximately 9 × 3.75 meters was created. The route was a ‘U’ shape.
The main researcher, the designer, the app developer and a blind user participated in the activities.
It is important that the developer attend the tests with the researchers to observe the performance of the application with actual users. The value of the engagement of the entire team in user interviews was observed by Knapp (2016) in a discussion of the Sprint Method:
It’s much faster, because everyone is absorbing the results at once. Your conclusions will be better as a group … You’ll avoid problems of credibility and trust, because each sprinter can see the results with his or her own eyes. And at the end of the day, your team can make an informed decision about what to do next – the results of the interviews (and the sprint) are still clear in everyone’s short-term memory. (p. 218)
The blind participant had no experience with smartphones and screen readers, so it was necessary to explain how they work. At some points, he exhibit difficulties unrelated to the application.
The beacons were unstable and did not always detect the user’s position during the tests. As a result, the application provided multiple audio directions, and this distracted the user during real-time browsing.
When guided navigation began, the voice that indicates the directions overlapped with the audio of the screen reader. These competing voices confused the user; thus, he did not understand what was being displayed.
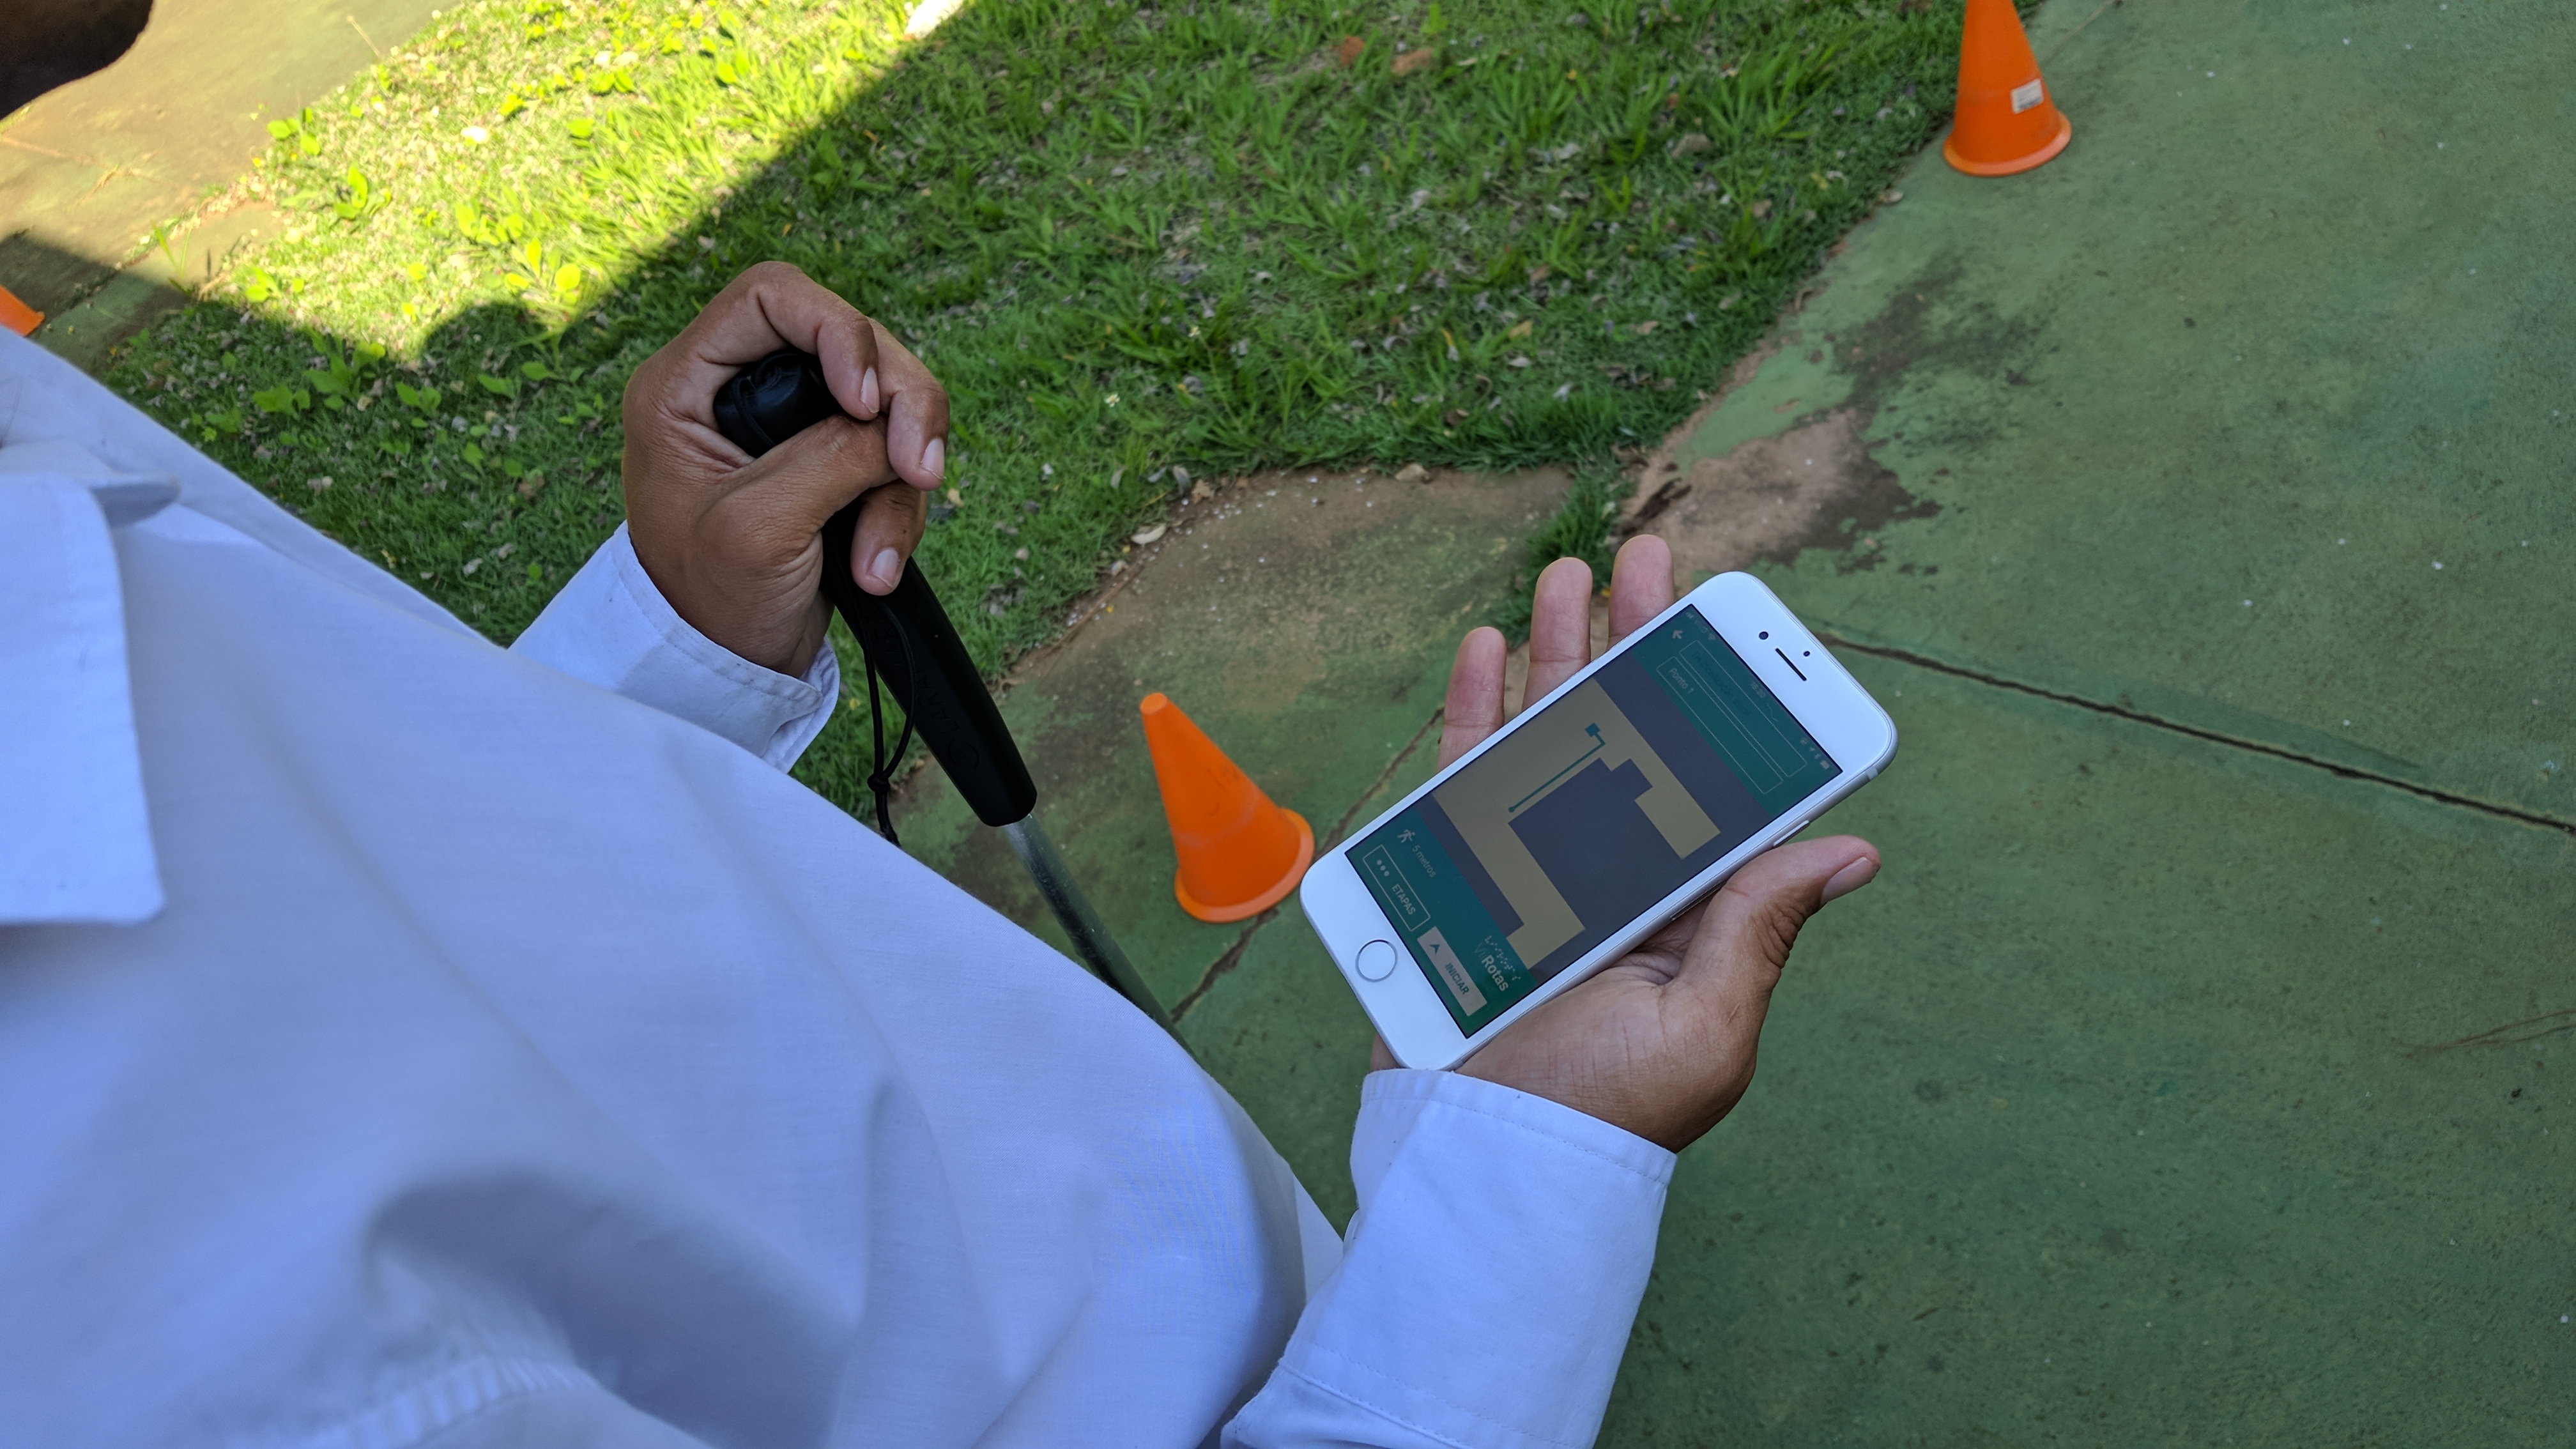
Smartphone and cane
It was also observed that the user had difficulty interacting with the smartphone while holding his cane. To accomplish the test, the cane was removed, and he walked holding the researcher’s arm. However, this was far from ideal because of the limitations to his autonomy.
After the test was completed, the researchers discussed the observations and tracked the changes needed to improve the product.
Conclusion
The study uncovered important deficiencies and points to needed areas for future research. Increasingly, technology is being used to improve accessibility, and this provides opportunities for creating and developing products and services.
After the application tests were performed, it was modified to address the accessibility issues that had been easily detected in the tests.
The application was unable to detect the user’s position in real time. There was a delay in device motion recognition; consequently, the route orientation was inaccurate. The decision was made to remove the real-time navigation feature and, instead, to have an identification be made only once when the route calculation was triggered by the user through the application. So, this functionality was pivoted. In the new proposal, after the calculation, the instructions become fixed and unchanged, and worked as a reference for the user.
As was identified in the introductory phase, the application is also useful for providing georeferencing for elderly and non-visually impaired users in large establishments.
A major challenge encountered during the study was the low adoption of new technologies among the elderly. This issue could be a barrier to entry for this audience. The low use of location applications among the elderly and visually impaired was also observed.
Despite these difficulties, the solutions developed in this study provide accessibility through the use of beacons. After a year of research, it was possible to generate information for the creation and development of new assistive technologies.
References
Bersch, R. de C. R. (2017). Introdução à tecnologia assistiva. Porto Alegre, Brazil. Retrieved from http://www.assistiva.com.br/Introducao_Tecnologia_Assistiva.pdf
Blank, S. (2013). The four steps to the epiphany: Successful strategies for products that win. BookBaby.
Brow, T. Why design thinking. IDEO. Retrieved from https://www.ideou.com/pages/design-thinking
Constable, G., & Rimalovski, F. (2014). Talking to humans: Success starts with understanding your customers. Giff Constable.
Cooper, A. (1998). The inmates are running the Asylum: Why high tech products drive us crazy and how to restore the sanity. USA: Sams – Pearson Education.
Design Council. (2005). The “Double-Diamond” design process model. Retrieved from http://www.designcouncil.org.uk/designprocess
Knapp, J., Zeratsky, J., & Kowitz, B. (2016). Sprint: How to solve big problems and test new ideas in just five days. New York, USA: Simon and Schuster.
Krug, S. (2006). Don’t make me think! A common sense approach to web usability. Berkeley, USA: New Riders.
Lévi-Strauss, C. (1963). Structural Anthropology. USA: Basic Books.
Monk, A., Wright, P., Haber, J., & Davenport, L. (1993). Appendix 1 – Cooperative Evaluation: A run-time guide. In: Improving your human-computer interface: a practical technique. Prentice-Hall.
Moran, K. (2018) Quantitative User-Research Methodologies: An Overview. Retrieved from https://www.nngroup.com/articles/quantitative-user-research-methods/ [accessed on 13 Jan 2019]
Norman, D. (2013). The design of everyday things. New York, USA: Basic Books.
Oppermann, R., & Reiterer, R. (1997) Software evaluation using the 9241 evaluator usability evaluation methods. Behaviour and Information Technology, 16(4/5), p. 232-245.
Osterwalder, A., & Pigneur, Y. (2010) Business model generation: A handbook for visionaries, game changers and challengers. New Jersey, USA: John Wiley & Sons.
Queiroz, M. A. (2008). Navegação via teclado e leitores de Tela. Retrieved from http://www.acessibilidadelegal.com/33-leitores.php
Snyder, C. (2003). Paper prototyping — the fast and easy way to design and refine user interfaces. San Francisco, USA: Morgan Kaufmann.
Stickdorn, M., & Schneider, J. (2012). This is service design thinking: Basics, tools, cases. Amsterdam, Netherlands: BIS Publishers.
Teixeira, F. (2014). Tudo o que você precisa saber para começar a brincar com iBeacons. UXdesign.CC Brasil. Retrieved from https://brasil.uxdesign.cc/ tudo-o-que-voc%C3%AA-precisa-saber-para-come%C3%A7ar-a-brincar-com-ibeacons-fdf5847e640b#.exk0gqzf5
Venturelli, M. (2014). Indústria 4.0: uma visão da automação industrial. Automação industrial. Retrieved from http://www.automacaoindustrial.info/industria-4-0-uma-visao-da-automacao-industrial